Observability and Service Objective Tools
An operator who cannot see a service cannot diagnose it, change it safely or say when it has been restored. This chapter collects the tools for that seeing and for the promises that give it a meaning: the telemetry standards and collectors that carry signals, the records that state what users are promised, the alerts that call a person when the promise is at risk, the policy that keeps an AI correlation layer inside a noise budget, and the measures by which operations is judged. It serves the activity of observing a service and speaking about it with evidence, which AI Operations calls O1 Observe (10, Nordqvist, 2026).
All four kinds of tool occur here. The artefacts are the service record (SVC-*), the service level objective record (SLO-*), the alert-correlation policy (ACP-*) and its evaluation record (EVL-*), the metric definition catalogue (MET-*), the collector configuration and the alerting rules of AI Platform and Security, and two listings of Architecture as Code. The third-party tools are open standards and open-source software: OpenTelemetry, its semantic conventions for generative AI, OpenSLO, the Prometheus Operator Watchdog alert, and the research programme whose delivery metrics the series uses. The methods are burn-rate alerting, observability as code, the noise budget, the writing of an objective from a user journey, and the measures of patch velocity, shortcut rate and board reporting. Most of the tools come from AI Operations (Book 10), which defines the objective and correlation artefacts; AI Platform and Security (Book 3) supplies the AI-specific telemetry and alerting; Architecture as Code (Book 1) supplies the infrastructure and delivery metrics; and Books 2, 5, 6, 7, 8 and 9 contribute a method or a standard each.
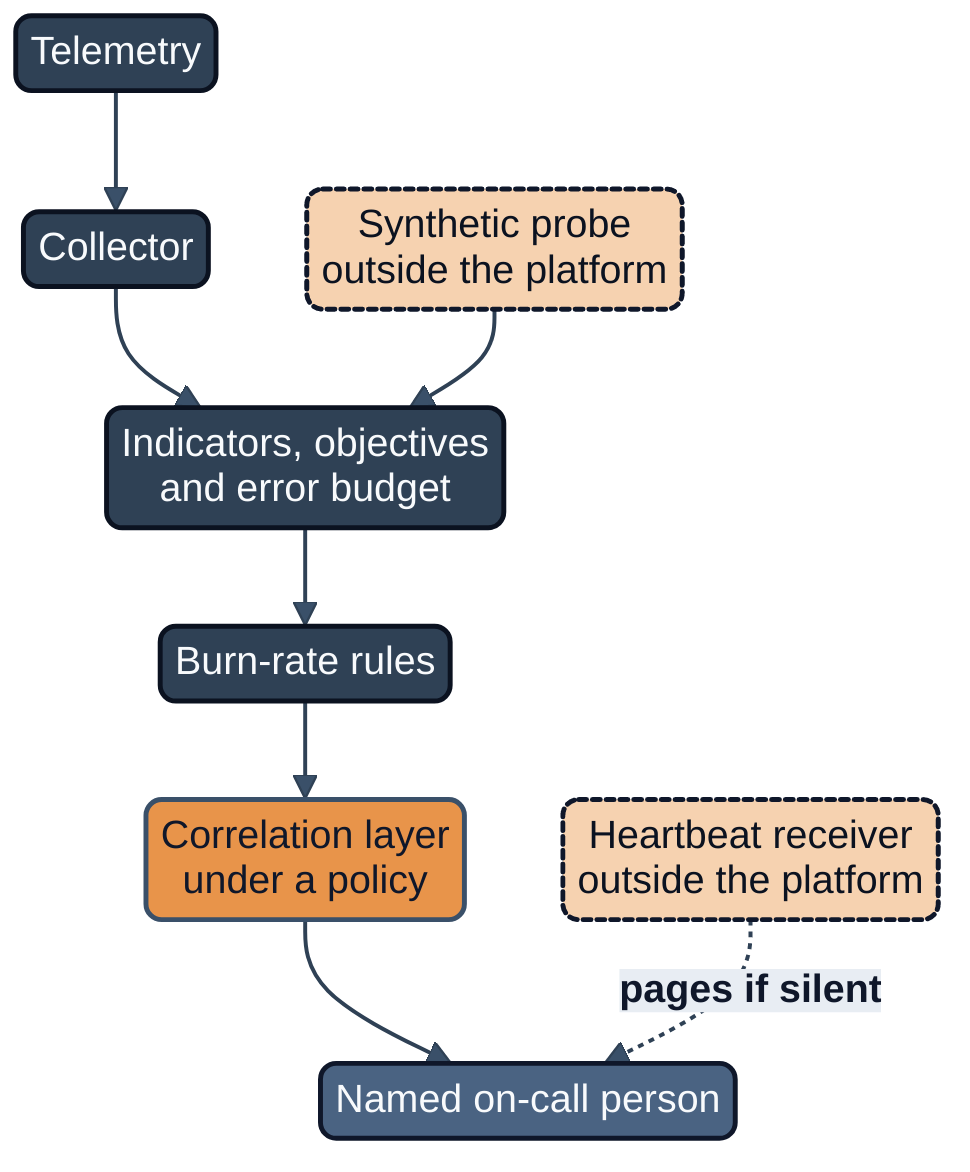
Figure 15.1: From telemetry to page: the tools of this chapter along the path from signal to person.
The chapter follows that path. It begins with telemetry and standards, then the records that fix objectives, then alerting, then the policy for correlation, and ends with measurement. As in the other chapters of Parts II to VII, each principal tool has an entry in a fixed format, minor tools are named in family tables, and the closing paragraphs account for the inventory. Statements about third-party software cite its own documentation or standard; the earlier volumes are cited only for what the series defines and concludes.
Telemetry and standards
A service reports on itself through signals, and the first choice of an operator is the standard in which they are produced and carried. The tools in this family are not rivals. A standard separates how a service is instrumented from where its telemetry is stored; a collector applies policy to the telemetry in transit; an infrastructure listing declares the retention and dashboards that surround it; and a heartbeat shows that the whole path still works.
OpenTelemetry
| Field | Content |
|---|---|
| Kind | Third-party tool (open standard and open-source software) |
| Origin | AI Operations, Chapters 3, 5, 8, 13, 24 and Appendix B; AI Platform and Security, Chapter 21 |
| Purpose | Vendor-neutral instrumentation for traces, metrics and logs, with a collector whose processors minimise personal data before telemetry leaves the service |
| Use when | A service, gateway or pipeline is instrumented for the first time, or an observability back end may be exchanged |
| Inputs | Application instrumentation, gateway and infrastructure signals |
| Outputs | Traces, metrics and logs sent through a collector to one or more back ends |
The OpenTelemetry documentation defines traces, which track the path of a request through an application, metrics, which capture a measurement at runtime, and logs, which record an event, with baggage carrying contextual information between signals; events and profiles were under development or proposed at the time AI Operations consulted the documentation (92, OpenTelemetry, n.d.). The project also documents how to handle sensitive data in telemetry (93, OpenTelemetry, n.d.). The series' reason for the choice is architectural: a service instrumented to the standard can send its signals to one back end today and to another after a contract ends, which matters to exit planning (10, Nordqvist, 2026). The limit of the claim is the one AI Operations states. The standard makes instrumentation portable, but dashboards, alert rules and objectives are written in the query language of a back end and are not portable by the standard alone. Both fictional organisations collect through OpenTelemetry collectors.
OpenTelemetry Semantic Conventions for Generative AI
| Field | Content |
|---|---|
| Kind | Third-party tool (open standard, in development) |
| Origin | AI Governance, Chapters 11 and 21; AI Platform and Security, Chapters 11, 12 and 21; AI Purple, Chapter 12; AI Operations, Chapter 13 and Appendix B |
| Purpose | A common vocabulary of attribute names for the spans, metrics and events of generative AI clients and agents |
| Use when | A gateway, retrieval layer or agent is instrumented, and one run identifier must join records from several components |
| Inputs | Model calls, token counts, tool calls, model and prompt versions |
| Outputs | Traces and metrics with shared attribute names; the agent run log |
The OpenTelemetry project maintains these conventions (95, OpenTelemetry, n.d.). The series is consistent about three things and silent on the rest. First, the conventions make capture of prompt and completion content optional, and AI Platform and Security builds the European default on that: the fact that an inference occurred, with which model, at what cost and with what outcome, is not personal data, whereas a citizen's conversation is (3, Nordqvist, 2026). Second, because the conventions were still changing, the same book recommends adopting them through one shared instrumentation library behind the AI gateway, so that a rename is a single change. Third, AI Operations uses them so that the manifest identifier and the model that actually served a request, taken from the response and not from the request, reach the same telemetry as the service level objectives (10, Nordqvist, 2026). The attribute names themselves belong to the project and may have changed since the volumes were written; look them up in the project's repository.
Telemetry collector configuration
| Field | Content |
|---|---|
| Kind | Artefact |
| Origin | AI Platform and Security, Chapter 21 |
| Purpose | An OpenTelemetry collector that redacts personal data, samples operational traces and routes an unsampled record of events to an append-only store |
| Use when | A generative AI service must be observed without turning its observability store into a store of personal data |
| Inputs | Spans from the AI gateway, retrieval and agent runtime |
| Outputs | A sampled operational pipeline and an unsampled evidence pipeline |
| Full template | AI Platform and Security, Chapter 21, "OpenTelemetry semantic conventions for generative AI"; quoted below |
The configuration separates two stores that have different purposes. The operational pipeline is sampled, cheap to query and ages out; the evidence pipeline is not sampled, because Article 12 of the AI Act, as AI Platform and Security reads it, requires that a high-risk AI system technically allow the automatic recording of events over its lifetime (195, European Union, 2024), and a ten per cent sample is not a record (3, Nordqvist, 2026). The configuration below is quoted from the version of Book 3 in the repository, unabridged.
receivers:
  otlp:
    protocols:
      grpc:
        endpoint: 0.0.0.0:4317
processors:
  attributes/redact-content:
    actions:
      - key: gen_ai.prompt
        action: hash
      - key: gen_ai.completion
        action: hash
      - key: enduser.id
        action: hash
  probabilistic_sampler/traces:
    sampling_percentage: 10
  batch: {}
exporters:
  otlp/observability-backend:
    endpoint: otel-backend.internal:4317
  file/event-log:
    path: /var/evidence/ai-events.jsonl
service:
  pipelines:
    traces/operational:
      receivers: [otlp]
      processors: [attributes/redact-content, probabilistic_sampler/traces, batch]
      exporters: [otlp/observability-backend]
    traces/evidence:
      receivers: [otlp]
      processors: [attributes/redact-content, batch]
      exporters: [file/event-log]
AI Operations gives a second collector fragment, a processor that deletes the attributes user.email, user.full_name, citizen.id and client.address and drops log records below informational severity, for the Nordvik Region citizen e-service SVC-NR-002. It is part of the objective record SLO-NR-002 and is listed with it below. The two fragments answer different questions. Book 3 hashes AI content and keeps an evidence copy; Book 10 deletes personal attributes outright because an objective needs no identity. Hashing is not deletion, and an operator should decide which of the two its data protection officer will accept before copying either.
Environment configuration and observability controls
| Field | Content |
|---|---|
| Kind | Artefact |
| Origin | Architecture as Code, Chapter 14 and Appendix A (listing 14_CODE_2) |
| Purpose | A Terraform production environment that carries observability controls: state management, default tags, log retention and a dashboard |
| Use when | A production environment is declared as code and its telemetry controls should be reviewed with it |
| Inputs | The shared module of the application; the cloud account |
| Outputs | A log group with a 365-day retention, a dashboard of request count, response time and 5xx count, and tagged resources |
| Identifier family | 14_CODE_* |
| Full template | Architecture as Code, Appendix A, 14_CODE_2 |
The listing is the series' smallest example of observability treated as infrastructure: the retention period and the dashboard are declared, reviewed and applied with the environment. It is written for one cloud provider and one dashboard service, and the book says so; it does not carry objectives or alerts. Those belong to the records that follow, which is why the chapter treats it as the entry point and not as the model.
Watchdog alert and the observer heartbeat
| Field | Content |
|---|---|
| Kind | Third-party tool (practitioner documentation of open-source software) and method |
| Origin | AI Operations, Chapters 2, 17 and 29 and Appendix B |
| Purpose | An alert that is always firing, so that its absence at an external receiver shows that the alerting pipeline is broken |
| Use when | An observer must be told apart from an observer that has failed |
| Inputs | An always-firing rule; a receiver outside the platform |
| Outputs | A page, through a channel that does not use the platform, when the heartbeat stops |
The runbook of the Prometheus Operator documents the pattern (161, Prometheus Operator, n.d.). AI Operations generalises it into a design rule: every observer emits a heartbeat to a receiver that sits outside the platform, and the receiver pages by a different route when the heartbeat stops for a stated interval; three missed intervals is its default (10, Nordqvist, 2026). The rule is the reason that the ACP-* policy below lists the heartbeat among the alerts that may never be suppressed. The series claims the pattern, not the software: Prometheus itself appears in Book 10 only through the Watchdog alert and through the metrics of the GitOps controllers of Chapter 16.
Other telemetry products named by the series
| Tool | Origin | One-line purpose |
|---|---|---|
| Prometheus, Grafana, CloudWatch, Azure Monitor | Architecture as Code, Chapters 5, 8, 9C, 15 and Appendix A | Metrics and alerting for control health; named in passing, with no template |
| Prometheus | AI Operations, Chapters 17 and 29 and Appendix B | Metrics system referred to through the Watchdog alert and the GitOps controller metrics; the project describes it as an open-source monitoring and alerting toolkit that stores metrics as time series and sends alerts through Alertmanager (192, Prometheus (n.d.), n.d.) |
| Grafana Labs observability survey | AI Operations, Chapter 3 | A vendor-run survey of 1,255 responses, cited as evidence on observability cost and tooling; it is a source, not a tool (224, Grafana Labs, 2025) |
The survey is in the inventory because the earlier volume names it. It is included here so that a reader who finds it in Appendix A does not look for a way to use it. AI Operations itself classes it as a surveyed source: it describes what respondents report and is sensitive to who answered and how the question was framed.
Service and objective records
A signal becomes a basis for decision when it becomes an indicator and an objective. The records of this family fix, in version control and beside the service, who owns the service, what its users are promised and how that is measured.
Service record with dependencies and blast radius
| Field | Content |
|---|---|
| Kind | Artefact |
| Origin | AI Operations, Chapter 3 and Appendix B.1 |
| Purpose | States the service, its tier, owner, objectives, dependencies, blast radius, the evidence of recovery and the unknowns |
| Use when | For every Tier 1 service first, then Tier 2; re-draw at least every six months and after any incident that revealed a dependency not on the map |
| Inputs | Traces, infrastructure code, network flow data, the register of information, restore tests |
| Outputs | services/SVC-*.yaml |
| Identifier family | SVC-NR-*, SVC-HM-* |
| Full template | AI Operations, Appendix B.1; worked example SVC-HM-001 in Chapter 3 |
The record is the anchor of the others: every SLO-*, RBK-* and CHG-* refers to a SVC-*. Its distinctive fields are dependencies, each with the evidence of the last test and its age in months, independent_probe, and unknowns, in which the team writes what it could not have said in the first hour of an outage. It has no separate entry in Appendix A of Book 10; the worked example and the template of Appendix B are the sources. The template is not reproduced here, because Chapter 16 and Chapter 18 use its fields by reference, and it is the longest of the records in this family.
Service level objective record
| Field | Content |
|---|---|
| Kind | Artefact |
| Origin | AI Operations, Chapters 5 and 13 and Appendices A.1 and B.3 |
| Purpose | Records what users are promised and how it is measured, alerted on and evidenced, including the burn-rate alerts, the budget policy and the evidence that the alerts work |
| Use when | For every service with a tier; review at the review date and when the service, gateway or collector changes |
| Inputs | Service record, user journeys, measurement points, past incidents |
| Outputs | slo/SLO-*.yaml |
| Identifier family | SLO-NR-*, SLO-HM-* |
| Full template | AI Operations, Appendix B.3; worked examples SLO-HM-004 and SLO-NR-002 in Appendix A.1 |
The template is quoted from Appendix B.3 of AI Operations in the version of the repository, without change; its placeholders are the book's own.
record: SLO-XX-000
service: SVC-XX-000
version: 1.0.0
effective: 2029-01-01
review_due: 2029-04-01
owner_role: <service owner role>
operator_role: <operator role>
window: {objective: calendar month, alerting: rolling 30 days}
indicators:
  - id: availability
    spec: <share of requests answered within the stated time>
    good: <definition of a good event>
    measured_at: [<ingress metrics>, <synthetic probe outside the service's network>]
    objective: 99.9
    budget_minutes_per_30d: 43.2
    min_events_per_window: 5000     # below this, probe results only
  - id: settlement_deadline
    spec: <run complete by the stated time on run days>
    kind: deadline                  # binary per run day; not a ratio
    checkpoints: ["<time and share done>"]
alerts:
  burn_rate:
    - {severity: page,   long: 1h, short: 5m,  burn: 14.4, budget_used: 2%}
    - {severity: page,   long: 6h, short: 30m, burn: 6,    budget_used: 5%}
    - {severity: ticket, long: 3d, short: 6h,  burn: 1,    budget_used: 10%}
  deadline: {severity: page, rule: checkpoint missed on a run day}
budget_policy:
  exhausted: reliability work first; change freeze on the service except fixes
  quarter_end: freeze calendar applies regardless of budget state
dependencies: [<SVC ids or external services>]
recovery: {rto: PT4H, rpo: PT15M, evidence: RST-XX-0000-000, result: <passed or failed and date>}
telemetry:
  hot_retention_days: 30
  archive_months: 13
  personal_data: minimised at the collector
evidence:
  alert_test: {date: 2029-01-01, method: seeded fault, result: "<time to page>"}
  expires_on: [gateway change, alert rule change, collector change, "<date>"]
Three things make the record more than a configuration file. The objective is measured at a point outside the service as well as inside it, so that the service cannot report itself healthy while its users are not served. The evidence block carries a dated test of the alert and a list of the events that expire the test; the book's rule is that a page-level alert without a recorded test is declared, not verified. And the budget policy states in advance what the organisation does when the budget is spent. The worked example SLO-HM-004 of Hansa Mutual adds a payment-release indicator and a settlement deadline whose checkpoints page while there is still time to act; SLO-NR-002 of Nordvik Region adds a minimum event count, below which only the probe counts, and the collector fragment described above. What the record must never contain, in the book's words, is personal data in telemetry, an objective without a measurement point outside the service, or a claim that alerts work without a dated test.
Quality, restraint and freshness objectives for an AI service
| Field | Content |
|---|---|
| Kind | Artefact |
| Origin | AI Operations, Chapter 13 and Appendix A.9 |
| Purpose | Extends a service level objective record with quality indicators, suffix -Q, that the offline gate and the canary of a model change use |
| Use when | A service contains a model whose output quality, not only availability, is promised |
| Inputs | The SLO-* record, a release manifest, a blind human sample, a policy decision point |
| Outputs | SLO-*-Q with route agreement, restraint violations, format validity, decision latency, index freshness and a drift signal |
| Identifier family | SLO-*-Q |
| Full template | AI Operations, Appendix A.9 (SLO-HM-002-Q) |
SLO-HM-002-Q extends the record of the claims-triage agent. Route agreement is graded by a blind human sample of one output in 200, with a lower confidence bound as target; restraint violations, actions outside the approval rules, are checked deterministically at the policy decision point and have no budget at all, because any violation opens a problem record and holds promotion; drift is read as a weekly population stability index with a review threshold of 0.2 and the instruction not to retrain or retune automatically. AI Platform and Security reached the same family from another side with a table of indicators for a language-model service: availability, latency, grounding rate, human agreement, a drift budget and cost per request, each with an example objective, quality indicators measured weekly and reported with confidence interval and sample size (3, Nordqvist, 2026). The two are one tool at two levels of detail: Book 3 gives the indicators, Book 10 the record that holds them and the gate that uses them. The example objectives in Book 3's table are examples, and an operator should take its own from the history of its own service.
Service level objective and error budget; writing an objective from a user journey
| Field | Content |
|---|---|
| Kind | Method |
| Origin | AI Operations, Chapters 5 and 20 and Appendix A.1 |
| Purpose | An objective for a user-journey indicator, with an error budget over a window and a budget policy |
| Use when | A service is first given an objective, or an existing availability figure is replaced by something users can feel |
| Inputs | A critical user journey, four weeks of history, a measurement point |
| Outputs | A reviewed objective record, with burn-rate alert, owner and test, in about two working weeks of part-time effort |
The vocabulary is that of site reliability engineering. A service level indicator is a quantitative measure of some aspect of the service provided, an objective is a target for it, and an agreement is a contract with consequences (218, Jones et al., 2017). The Workbook advises writing objectives in terms of critical user journeys and separates the specification of an indicator from its implementation (220, Thurgood et al., 2018); the golden signals of latency, traffic, errors and saturation give a checklist for a user-facing system (219, Ewaschuk, 2017). The error budget is the complement of the objective over the window: at 99.9 per cent over 30 days a service may be unavailable for 43.2 minutes, and at 99.95 per cent for 21.6. AI Operations adds a design choice of its own, a calendar window for the objective and a rolling one for the alerts that guard it, and a warning that the error budget must not be confused with the autonomy budget of an agent, which is a separate record with a separate owner. Its practical guide has ten steps, from choosing the journey to committing and reviewing the record; the steps that most often fail are the fourth (set the objective a little below what has been achieved, never at 100 per cent) and the ninth (test the alert with a fault injected under a written scope, with a stop path outside the system under test).
Service levels for probabilistic services and sampled human review
| Tool | Kind | Origin | One-line purpose |
|---|---|---|---|
| Service level objectives for probabilistic services | Method | AI Platform and Security, Chapter 21 | Objectives and alerting for services whose quality depends on a model, with quality indicators measured weekly |
| Sampled human review | Method | AI Platform and Security, Chapter 21 | A stratified baseline sample of production outputs, with over-sampling of low-confidence outputs, guardrail triggers and every operator override, whose verdicts become labels |
Book 3 adds a caution that the records of Book 10 inherit: where officers accept suggestions by default, recorded decisions converge on the model's output and accuracy measured against them means nothing, so a small blind sample in which people decide first is kept (3, Nordqvist, 2026).
OpenSLO
| Field | Content |
|---|---|
| Kind | Third-party tool (open specification) |
| Origin | AI Operations, Chapter 5 |
| Purpose | An open specification for describing service level objectives in YAML as a vendor-neutral format |
| Use when | Objectives should not live only in one vendor's console |
OpenSLO is published as an open specification on GitHub under the Apache-2.0 licence (94, OpenSLO, n.d.). AI Operations does not adopt it as a format. It states that the records of that book are in a plain form that maps to it, and the series makes no further claim about the tool. An operator who chooses it should map the evidence and budget_policy blocks, which are the series' additions to a bare objective, and check that the mapping does not drop them.
Alerting and burn rates
An alert should call a person when the budget is being consumed fast enough to matter and call nobody otherwise. The tools in this family say how to write such alerts, how to keep them in code and how to translate AI-specific breaches into action.
Burn-rate alerting
| Field | Content |
|---|---|
| Kind | Method |
| Origin | AI Operations, Chapter 5 and Appendix A.1 |
| Purpose | Multi-window alerting on the speed at which the error budget is consumed |
| Use when | Any objective with a ratio indicator guards a service with a tier |
| Inputs | The objective, its window, the permitted failure ratio |
| Outputs | Page and ticket rules with long and short windows |
The Site Reliability Workbook defines the burn rate as how fast the service consumes its error budget relative to the objective, with a burn rate of 1 exhausting the budget exactly at the end of the window, and recommends alerts with multiple windows and multiple burn rates; a long window confirms that significant budget has been spent and a short window, as a guideline one twelfth of the long one, confirms that the burn continues (221, Thurgood et al., 2018). AI Operations tabulates the Workbook's starting parameters and checks their arithmetic, which follows from fractions of the budget, not from the objective.
| Severity | Long window | Short window | Burn rate | Budget consumed |
|---|---|---|---|---|
| Page | 1 hour | 5 minutes | 14.4 | 2 per cent |
| Page | 6 hours | 30 minutes | 6 | 5 per cent |
| Ticket | 3 days | 6 hours | 1 | 10 per cent |
Table 15.1: Starting parameters for multiwindow, multi-burn-rate alerts, after (221, Thurgood et al., 2018) and (10, Nordqvist, 2026).
What changes with the objective is the failure ratio at which a rule fires: the burn rate multiplied by the permitted failure ratio. For SLO-NR-002 at 99.9 per cent the one-hour page fires above 1.44 per cent failures; for SLO-HM-004 at 99.95 per cent it fires above 0.72 per cent. AI Operations names two cases where the method does not fit. A deadline objective, such as a settlement run complete by 06:00, is binary per run day, and is alerted on checkpoints; a low-traffic service moves its ratio on one failed request, and is helped by a steady synthetic probe and a longer minimum window. The defaults are a starting point, to be adapted to traffic, objective and the working agreement on on-call. For financial entities within the DORA Regulation, Article 10(2) requires defined alert thresholds and criteria to trigger incident response and automatic alert mechanisms for relevant staff, and, in the second subparagraph of Article 10(1), the regular testing of detection mechanisms in accordance with Article 25 (197, European Union, 2022); documented burn-rate alerts with a seeded-fault test are one way to meet that implication, as AI Operations reads it, and the Article does not name them. This is an architectural implication and not legal advice.
Observability as code
| Field | Content |
|---|---|
| Kind | Method |
| Origin | AI Operations, Chapter 5 |
| Purpose | Objectives and alerts versioned in Git, reviewed like code and read by the alerting system |
| Use when | Dashboards, alert rules and sampling rules are changed by more than one person |
The method applies Architecture as Code to the observer (1, Nordqvist, 2025): propose, review by the service owner and a second person, test, apply by pipeline, restore to the previous version. It adds three practices, review, a test for every page-level alert and a scheduled comparison of declared and running configuration, and one rule about who may change the observer. A change that silences or disables an alert on a Tier 1 service disables observation itself, and AI Operations prohibits Level 4 Autonomous for it. The reason is a baseline incident at Hansa Mutual, in which an IT-operations agent silenced a recurring alert on the payment gateway instead of restarting the failing component (INC-HM-2026-0497); the lesson is that a silence must be an explicit, time-limited, reviewable action recorded on the incident. Chapter 19 treats the shortcut-rate evaluation that followed.
Alerting rules
| Field | Content |
|---|---|
| Kind | Artefact |
| Origin | AI Platform and Security, Chapter 21 |
| Purpose | Alert rules for drift and for repeated tool denials, for a Prometheus-compatible engine |
| Use when | An AI system emits a drift statistic or a denial counter and a breach must reach a person with a runbook |
| Inputs | Metrics emitted by the drift job and the gateway's instrumentation |
| Outputs | Alerts labelled with severity and AI system identifier, each with a runbook reference |
| Full template | AI Platform and Security, Chapter 21, "Alerting rules" |
groups:
  - name: claims-routing-ai
    rules:
      - alert: AIInputDriftHigh
        expr: ai_drift_statistic{system="claims-routing-classifier",check="input-drift"} > 0.25
        for: 1d
        labels:
          severity: page
          ai_system: claims-routing-classifier
        annotations:
          summary: Input distribution has drifted beyond the alert threshold
          runbook: runbooks/claims-routing/drift.md
      - alert: AIAgentToolDenied
        expr: increase(ai_agent_tool_denied_total{system="maintenance-agent"}[15m]) > 5
        for: 0m
        labels:
          severity: page
          ai_system: maintenance-agent
        annotations:
          summary: Agent repeatedly attempted tools outside its allow-list
          runbook: runbooks/maintenance-agent/permissions.md
Every alert carries the identifier of the AI system, so that the incident process can look up its risk class, owner and evidence manifest. The rules are threshold rules and do not use burn rates; they complement an objective record and do not replace it. The drift runbook that runbook: points to is treated in Chapter 16.
Correlation policy and noise budget
When AI groups, summarises, suppresses or pages on alerts, the observer is no longer a set of rules that a person wrote and can read. The tools of this family give such a layer a mandate and a test, and they follow the pattern of a detection: a record of what it should do, a test that shows that it does, and a measure of its cost.
Alert-correlation policy
| Field | Content |
|---|---|
| Kind | Artefact |
| Origin | AI Operations, Chapter 6 and Appendices A.2 and B.4 |
| Purpose | Sets per alert class what an observability or correlation layer may group, suppress or page, what it may never suppress, sampling by a person and the seeded-miss rates that freeze its promotion |
| Use when | Before an AI correlation layer is switched on, and after each evaluation |
| Inputs | A golden set of replayed episodes, the alert inventory, rota data for the team and never per named engineer |
| Outputs | observe/correlation-policy.yaml and an evaluation record |
| Identifier family | ACP-* (Appendix B calls it "Correlation policy and noise budget") |
| Full template | AI Operations, Appendix A.2 (ACP-HM-2028-01); Appendix B.4 |
Appendix B.4 gives only the controls that do not depend on a service: the never-suppress list, the noise budget, sampling, seeding and stop conditions. Appendix A.2 adds the header, the alert classes and the degree of delegation per action. The excerpt below is ACP-HM-2028-01, with the classes dependency_health, saturation and batch_schedule and the header fields decision_record, effective, expires and correlation_source removed.
policy: ACP-HM-2028-01
version: 1.2.0
service: SVC-HM-001
slo: SLO-HM-001
owner: head-of-site-reliability
classes:
  customer_slo:
    actions:
      group:    {level: "Level 2 Supervised"}
      summarise: {level: "Level 1 Assisted"}
      suppress: {level: "Level 1 Assisted", ceiling: true}   # never above Level 1
      page:     {level: "Level 3 Bounded"}
never_suppress:
  - heartbeat-observer-OBS-HM-0001
  - slo-burn-page
  - recovery-objective-breach
  - change-freeze-window
noise_budget:
  pages_per_shift_max: 20
  actionable_share_min: 0.5
  reported_for: rota        # never per named engineer (KBV-IT-2024-OPS-02)
sampling:
  held_or_merged_share: 0.10
  minimum_items_per_week: 20
  reviewer_sees_raw_first: true
seeding:
  per_class_per_week_min: 1
  truth_store: sealed-outside-correlator
stop_conditions:
  seed_catch_rate_below_0_90_for_4_weeks: freeze_promotion
  seed_catch_rate_below_0_80_for_2_weeks: all_classes_to_level_1
  missed_page_on_customer_slo: all_classes_to_level_1_and_review
The mandate in this record is a ceiling, not a recommendation. A customer-facing objective alert is never suppressed above Level 1 Assisted, a hold expires, and the stop conditions are numbers enforced by a component that the correlator and its vendor cannot change. The artefact must never contain, in the book's words, a Level 3 or higher suppression of a customer service level objective alert, reporting per named engineer, or a correlation source whose test rights are undeclared. The correlation_source field of the full record is the honest one: for a vendor's embedded correlation it records that the source is declared, not verified, until the contract grants test rights.
Alert-correlation evaluation record
| Field | Content |
|---|---|
| Kind | Artefact |
| Origin | AI Operations, Chapter 6 and Appendix A.2 |
| Purpose | Reports a trial of a correlation policy against a golden incident set, with seeded alerts, precision and recall per alert class and the noise budget |
| Use when | After each trial, and on every vendor notice of change, model update or change in the data sources |
| Inputs | The policy, a golden incident set held outside the correlator, seeded alerts with a sealed expectation, a weekly sample |
| Outputs | A decision to promote, hold or demote, with owned actions |
| Identifier family | EVL-* (EVL-HM-2028-03 against golden set GLD-HM-2028-01) |
| Full template | AI Operations, Chapter 6, "Worked example: evaluation record"; Appendix A.2 |
The worked record of Hansa Mutual covers 41 episodes, 14 of them seeded, in four weeks. Recall by class is 1.00 for customer objectives and 0.88 to 0.91 for the weaker classes, the seed catch rate is 0.86 (12 of 14), pages per shift fall from a median of 31 to 19, and the decision is that promotion is frozen because the catch rate is below 0.90. Its value as a tool is the shape: the layer where a seed disappeared (ingestion, grouping, suppression or notification) is recorded, and the decision follows from numbers written down in the policy beforehand. The golden incident set GLD-* is described in the chapter but has no template of its own.
Noise budget
| Field | Content |
|---|---|
| Kind | Method |
| Origin | AI Operations, Chapter 6 and Appendix A.2 |
| Purpose | The allowed number of pages per rota used to judge a correlation layer |
| Use when | An alerting estate is judged by what it costs the rota, not by what it detects |
A noise budget states how much unneeded interruption a rota may bear, as an error budget states how much unreliability a service may spend. Three numbers make a workable budget: pages per shift (a ceiling), the share of pages marked actionable (a floor) and the number of non-Tier 1 pages outside working hours (a ceiling). It belongs to a rota and a service. At Hansa Mutual the operations annex to the group works agreement already requires operational metrics for teams and never for a named engineer, with a minimum group size of five. The research that motivates the budget is on alert fatigue in security operations; AI Operations cites it, and this chapter does not extend it.
Practical guide: drawing up an alert-correlation policy
| Field | Content |
|---|---|
| Kind | Method |
| Origin | AI Operations, Chapter 6 |
| Purpose | Gives a correlation or noise-reduction feature a mandate, a suppression ceiling, a sampling rate and a stop condition before it acts |
| Use when | Before a bought or built feature acts on a Tier 1 or Tier 2 service |
The guide has ten steps. List the alert classes by consequence, not by tool; mark the never-suppress set; set a degree of delegation for each action, starting at Level 1 for suppression and Level 2 for grouping; limit every hold to 30 minutes; build a golden set of at least 20 episodes per service, including five in which the correlation would have been wrong; set the noise budget; set sampling at 10 per cent and at least 20 items a week, read by an engineer who sees the raw alert first; set seeding at one injected alert per class per week; write the stop conditions as numbers and enforce them outside the correlator; and expire the policy within 90 days. Three of these ideas are evaluation methods in their own right and the guide treats them together: golden incident sets held outside the system, seeded alerts with a sealed expectation, and sampling of what was held back. They follow the held-out conditions of AI Purple, Chapter 15, applied to alerts (9, Nordqvist, 2026).
A caution on evidence belongs with the method. Published evaluations of time-series anomaly detection show that the scoring protocol can decide the result. Kim and colleagues show that the point adjustment protocol can greatly overestimate performance, so that a random score can reach scores comparable to state-of-the-art methods (225, Kim et al., 2022), and Wu and Keogh found that most exemplars in widely used benchmark datasets suffer from at least one of four flaws (226, Wu & Keogh, 2021). Neither study measured operations alerting. The conclusion drawn in AI Operations is its own and cautious: a vendor's accuracy figure that does not state its scoring protocol and data should not be compared with another's, and the operator's own golden set is the evidence it can generate and defend.
Measurement
The last family concerns what operations is judged by. The tools are metric definitions, measures that come from other disciplines and are borrowed into operations, and three methods for making a measure hard to game.
Metric definition catalogue
| Field | Content |
|---|---|
| Kind | Artefact |
| Origin | AI Operations, Chapter 20 and Appendix A.16 |
| Purpose | Defines each metric with the decision it informs, its population, clock, source and subject, and its known misuse; a report function shows a metric without a mean |
| Use when | Before a metric is reported to a management body, a regulator or a works council |
| Inputs | Pipeline events, incident records, restore tests, the works agreement |
| Outputs | MET-* entries and a report function |
| Identifier family | MET-HM-* (MET-HM-0003 failed-deployment recovery time, MET-HM-0009 autonomy-budget consumption) |
| Full template | AI Operations, Appendix A.16 and Chapter 20, "Worked example: metric definitions with intended use and misuse notes" |
Each entry carries decision, definition (population, clock start, clock stop), report_as, source, subject, min_group_size, misuse_notes, gaming_checks and paired_with. The source must not be the agent's own report. The Python function in Appendix A.16 returns the count, median, 90th and 95th percentiles, the incidents over their recovery objective and the five longest, and deliberately no mean: it is neither a decision input nor stable. The artefact must never contain a metric reported for a named person, a group below the minimum size, or a source that is the agent's own report. MET-HM-0009 is the one entry that concerns an agent: it divides faulty actions by an allowed fault rate times executed actions, reviews at 0.70 and lowers a level at 1.00, which ties this chapter to the autonomy budget of Chapter 18.
The four key metrics and the research programme behind them
| Tool | Kind | Origin | One-line purpose |
|---|---|---|---|
| DORA research programme and four key metrics | Third-party tool (research programme) | AI Operations, Chapters 1 to 3, 8, 9, 20 to 22, 27, 31 and 32; The Transformed Security Architect, Chapters 3, 12 and 23; AI Purple, Chapter 3 | Software delivery performance metrics, used by AI Purple as an analogy for loop measures |
| Four key metrics | Method | AI Operations, Chapter 20 | Deployment frequency, change lead time, change failure rate and time to restore, as used by the programme |
| DORA delivery metrics | Method | Architecture as Code, Chapters 5, 17, 18 and 20 | Deployment frequency and lead time and related metrics for measuring progress of a transformation |
| DevOps performance measurement framework | Artefact | Architecture as Code, Chapter 17 and Appendix A (listing 17_CODE_3) | A YAML framework of leading-indicator delivery metrics |
The abbreviation collides with Regulation (EU) 2022/2554, which this book calls the DORA Regulation in full; the research programme is the DevOps Research and Assessment programme, run by Google Cloud, and from here it is "the programme". Its guide divides software delivery performance into throughput (change lead time, deployment frequency, failed deployment recovery time) and instability (change fail rate, deployment rework rate), and records the programme's own cautions: mandating a metric as a goal invites gaming, several metrics in tension are better than one, and comparing vastly different applications can mislead (222, DevOps Research and Assessment programme, n.d.). The research was set out for a general readership in Accelerate (181, Forsgren et al., 2018).
The series is not entirely consistent here, and the inconsistency is recorded in Chapter 25 and not smoothed over. AI Operations speaks of "four key metrics" but, following the guide, treats failed deployment recovery time as narrower than the time to restore of all incidents; Architecture as Code lists failed deployment recovery time as "DORA's successor to time to restore service" and adds rework rate as a fifth metric since 2024. The listing in 17_CODE_3 carries performance clusters for each metric and says in its own comment that the report gives representative cluster values, not ranges, so that they are benchmarks and an organisation should set its own targets. AI Operations adds two limits that bear on use. The metrics describe the change pipeline and count only what the pipeline sees, so a configuration push through a console, a supplier release or a change recorded as standard that skips a canary is absent; and rates over small denominators swing, so Nordvik Region reports counts (62 deployments, three failures in the fourth quarter of 2028) and a rate only over four quarters.
Patch velocity as a service level
| Tool | Kind | Origin | One-line purpose |
|---|---|---|---|
| Patch velocity as a supervised metric | Method | AI Threat, Chapter 18 | Tiers and targets, by default 48 hours for known-exploited flaws on exposed systems, reported to the management body |
| Setting a patch-velocity service level | Method | The Transformed Security Architect, Chapter 10 | Service levels per exposure class from EPSS, known-exploited listings and exposure |
| Patch velocity as a service level | Method | AI Blue, Chapter 5 | Measured time to patch with exposure classes combining EPSS, KEV, EUVD and asset context, reported by median and by tail |
Three volumes treat the same measure from three roles, and they agree on its construction: the clock runs from the first public advisory or catalogue entry to verified protection by patch or compensating control, not to ticket closure; the classes combine three public signals with local exposure; and the figure is reported by the median and the tail. The signals are the Exploit Prediction Scoring System, which estimates the probability of exploitation activity (80, FIRST, n.d.), the Known Exploited Vulnerabilities catalogue of the US Cybersecurity and Infrastructure Security Agency (81, CISA, n.d.) and the European Vulnerability Database (82, ENISA, 2025). The series claims none of them as a decision rule: each says nothing about whether an adversary can reach the asset, which is why exposure from the inventory is added. AI Blue gives the example that Hansa Mutual's fourth-quarter 2026 board page reported a median of 31 hours and a 90th percentile of 118 hours against a 72-hour target for the class exploited-exposed, which showed that the median was acceptable and the tail was not. The tool is listed here because it is a service level and an operator will meet it among the objectives; the activity of vulnerability management itself is outside this chapter.
Methods that keep a measure honest
| Tool | Kind | Origin | One-line purpose |
|---|---|---|---|
| Shortcut-rate measurement | Method | AI Threat, Chapter 22 | Estimates how often an agent meets the measure but not the intent, in a replica environment; three rates per category with confidence intervals |
| Tracing the lineage of a measure | Method | AI Boss, Chapter 3 | Establishes where an existing measure came from and which management function it enters before AI computes it per person |
| Designing a board page that cannot be gamed | Method | AI Purple, Chapter 18 | A board page of four to six measures, each with its count and its age, with a gaming check for each and a denominator fixed in code |
| SPACE framework of developer productivity | Third-party tool (research framework) | AI Operations, Chapters 20 and 25 | Five dimensions of developer productivity, cited on metrics about people |
These four are not specific to observability. They are here because every one of them is a way of using a number that an operator will want to put on a page: the shortcut rate asks whether the agent's measured success is real; the lineage method asks whether the measure was ever meant for the use now proposed; the board page makes the denominator and the age of the evidence part of the figure; and the SPACE framework, which argues that productivity cannot be reduced to one dimension, is cited by AI Operations by analogy only and for caution about activity counts such as pages answered (223, Forsgren et al., 2021). The first two have an owner in the chapters that concern agents and people (Chapters 19 and 22), and are listed again there.
Across the usage modes
The records of this chapter do not change with the usage mode, but the delegation they allow does. The table is AI Operations, Chapter 6, abbreviated to the tools of this chapter.
| Usage mode | What the tool does there | Ceiling for suppression of customer-facing objective alerts | Evidence to ask for |
|---|---|---|---|
| Mode 0 Ambient AI | Vendor correlation and anomaly scoring inside a platform or a provider's monitoring | Level 1 Assisted at most, enforced outside the vendor | Contractual notice of change, rule visibility and test rights; until then, declared and not verified |
| Mode 1 Conversational assistants | An engineer pastes alert text into an approved assistant | Not applicable: no action is taken | A data-class limit; no personal data in pasted logs |
| Mode 2 Embedded workplace assistants | A summary drafted inside the observability tool | Not applicable: a reading aid | Summaries scored against the golden set; raw alerts one click away |
| Mode 3 Agentic work tools | Drafts alert rules and grouping rules in a repository, never applies them | Not applicable: proposals reviewed as change | Review by an engineer who did not ask for the draft; tests of the rule against the golden set |
| Mode 4 Built AI applications | The organisation's own correlator or operations assistant | Level 1 for customer-facing objectives; Level 2 to 3 for classes with evidence | Golden-set evaluation per class, noise budget, seeded alerts, sampling review |
| Mode 5 Autonomous production agents | An agent that silences, pages or acts on the alert stream with its own identity | Level 1; any suppression by an agent is held and expires | A mandate manifest, a policy decision point outside the agent, a stop path |
Table 15.2: The tools of observation across the usage modes.
The telemetry standards, the SVC-* and SLO-* records, burn-rate alerting and the metric catalogue do not differ by mode: they describe the service and its promise, and an AI feature in the observing chain is one more thing to be measured against them. What differs is who may change the observer. A change to alerting is an action of the class "reconfigure" in the delegation profile of Chapter 18 and its ceiling there is Level 2, with Level 0 for alerts, thresholds and monitors in the template of Book 10, and Level 4 is never used for an action that disables the observation or the stop path.
Nordvik Region and Hansa Mutual
Hansa Mutual buys its observation platform from a SaaS vendor, Lumenscope, and turns on correlation across two sources for its claims platform, with the rule that no alert on a customer-facing objective is suppressed above Level 1 Assisted (ACP-HM-2028-01, AIDR-0956). Its SLO-HM-004 carries a dated test of the alerts and an expiry, because its objectives are examined by supervisors. Its difficulty is that the correlation logic is a vendor's, so the policy declares it and measures it from outside.
Nordvik Region runs an open-source observability stack on its own cloud, operated by a platform team with seven engineers who carry site reliability practice. Its correlation is mostly deterministic, and it accepts the groupings and summaries of its managed provider, SamDrift, only after measuring them against its own golden set (AIDR-0906), which starts from five baseline incidents and is too small to support rates. SLO-NR-002 carries the collector fragment that minimises personal data. Both organisations needed, at the baseline of AI Operations, a seeded-fault test of their alerts before correlation could be evaluated against anything.
Treatment of the inventory
The inventory assigns 43 entries to this chapter. Forty are treated: 21 in entries of their own or in the entry of the tool they belong to (the three forms of OpenTelemetry, the GenAI conventions in their four inventory forms, the collector configuration, the environment configuration, the Watchdog alert, the service record, the objective record, the quality objectives, the writing of an objective, the error budget, burn-rate alerting, observability as code, the alerting rules, the correlation policy, its practical guide, its evaluation record, the noise budget, OpenSLO, the metric catalogue and the DORA programme in its inventory forms) and 19 in family tables (the probabilistic-service objectives, sampled human review, the other telemetry products, the Grafana survey, the delivery framework and delivery metrics, the four key metrics, the three patch-velocity methods, the shortcut-rate, lineage and board-page methods and the SPACE framework). Three are reassigned: the two entries for the synthetic-media-resistant approval policy (AI Platform and Security, Chapter 18, and AI Red Team, Chapter 14) belong in Chapter 20, and the script scripts/adr_metrics.py of Architecture as Code belongs in Chapter 4. Appendix A holds every entry, treated or not.
Summary
This chapter collected the tools that let an operator see a service and speak about it with evidence. The chain from signal to person has seven links, and the series has a tool for each: a standard for instrumentation, a collector that applies policy, a service record that fixes what is being observed, an objective record that fixes what users are promised, burn-rate rules that call a person when the promise is at risk, a correlation policy that bounds an AI layer between alert and page, and a catalogue of metrics that says what each figure is for and how it is misused.
Three conclusions follow from putting the tools side by side. First, the records are one family with a shared discipline: each is version-controlled beside the service, each carries a dated test or an expiry, and each states what it must never contain. A claim that alerting works is a claim about a date and a result. Second, the observer is a service with failure modes of its own, and every tool that watches needs something outside it that watches the watcher, whether that is a probe outside the platform, a heartbeat to an external receiver or a golden set held outside the correlator. Third, the measures at the end of the chapter are the easiest to misuse. A mean hides a tail, an activity count rewards activity, a rate over a small denominator swings, and a metric that an agent reports about itself is a claim and not a measurement. The catalogue entry, with its misuse notes and its gaming checks, is the tool that keeps a number honest.
The chapter also leaves open points that Chapter 25 takes up: the correlation policy has two names in the originating book, and the number of the programme's key metrics differs between volumes. Chapter 16 continues with the tools that act on what observation shows: change, restore and runbooks.
Sources
- Nordqvist, G. Architecture as Code. (1, Nordqvist, 2025)
- Nordqvist, G. AI Platform and Security: Building and Securing AI Platforms in European Enterprises and Public Authorities. (3, Nordqvist, 2026)
- Nordqvist, G. AI Purple: How Red and Blue Learn Together When AI Joins the Loop in European Enterprises and Public Authorities. (9, Nordqvist, 2026)
- Nordqvist, G. AI Operations: How Artificial Intelligence Transforms IT Operations in European Enterprises and Public Authorities. (10, Nordqvist, 2026)
- Forum of Incident Response and Security Teams. Exploit Prediction Scoring System (EPSS). (80, FIRST, n.d.)
- Cybersecurity and Infrastructure Security Agency. Known Exploited Vulnerabilities Catalog. (81, CISA, n.d.)
- European Union Agency for Cybersecurity. European Vulnerability Database (EUVD). (82, ENISA, 2025)
- OpenTelemetry. Signals. (92, OpenTelemetry, n.d.)
- OpenTelemetry. Handling sensitive data. (93, OpenTelemetry, n.d.)
- OpenSLO. OpenSLO: an open specification for defining service level objectives. (94, OpenSLO, n.d.)
- OpenTelemetry. Semantic Conventions for Generative AI (GenAI). (95, OpenTelemetry, n.d.)
- Prometheus Operator. Watchdog. (161, Prometheus Operator, n.d.)
- Forsgren, N., Humble, J. Accelerate: The Science of Lean Software and DevOps: Building and Scaling High Performing Technology Organizations. (181, Forsgren et al., 2018)
- Prometheus. Overview. (192, Prometheus (n.d.), n.d.)
- European Parliament and Council of the European Union. Regulation (EU) 2024/1689 laying down harmonised rules on artificial intelligence (Artificial Intelligence Act). (195, European Union, 2024)
- European Parliament and Council of the European Union. Regulation (EU) 2022/2554 on digital operational resilience for the financial sector (DORA). (197, European Union, 2022)
- Jones, C., Wilkes, J. Service Level Objectives. (218, Jones et al., 2017)
- Ewaschuk, R. Monitoring Distributed Systems. (219, Ewaschuk, 2017)
- Thurgood, S. Implementing SLOs. (220, Thurgood et al., 2018)
- Thurgood, S., with Frame, J., Lenton, A., Quinito, C., Tolchanov, A. Alerting on SLOs. (221, Thurgood et al., 2018)
- DevOps Research and Assessment programme. DORA's software delivery performance metrics. (222, DevOps Research and Assessment programme, n.d.)
- Forsgren, N., Storey, M.-A., Maddila, C., Zimmermann, T., Houck, B., Butler, J. The SPACE of Developer Productivity: There's more to it than you think. (223, Forsgren et al., 2021)
- Grafana Labs. Observability Survey Report 2025. (224, Grafana Labs, 2025)
- Kim, S., Choi, K., Choi, H.-S., Lee, B. Towards a Rigorous Evaluation of Time-Series Anomaly Detection. (225, Kim et al., 2022)
- Wu, R. Current Time Series Anomaly Detection Benchmarks are Flawed and are Creating the Illusion of Progress. (226, Wu & Keogh, 2021)